This is my first (of many, hopefully) post for T-SQL Tuesday. I’ve been watching for the next invite to come out, and I’m glad to see it’s on something that I can comment on, Automation.
I’ve been doing alot of work recently on Data Warehousing, and thought it’d be useful, and relevant, to run through one of the tools we use to automate the loading of Data Warehouses.
While we could (and do, sometimes) use SSIS to load the Data Warehouse, we primarily use a tool called WhereScape RED (Trial versions, whitepapers, etc. available here: http://www.wherescape.com). This  product makes the process of creating, prototyping, building, and the on-going running and maintenance of a Data Warehouse much more manageable, and efficient.
While you can read all about how to use this product online, I’m going to run through some of the key points, and how it actually interacts with SQL Server.
On the left you’ll see a list of the different types of data that RED can use and generate. If you’ve done any work with Data warehousing, the majority of these will be familiar to you.
Connection
These are the connections that are used to link RED with the data warehouse. This would include items such as flat files (on Windows or Unix), Analysis Services (2000 or better) or a database (using any form of ODBC connection).
Load Tables
Load tables are the source for all the data, so whether your data is coming from a file, another database or wherever, it’ll be brought into the system, through here, and into a table called load_<something>. These are created in a nice straightforward manner,  by dragging the file from a Source Browser (on the right), into the main window (as seen below). This then creates a table, with a set of fields, which are then used to populate the automatically generated documentation!
It’s worth pointing out that, which each of the steps allow you to customise the T-SQL generated by RED, the Load process is the only one that doesn’t allow you to see the initial script, though you can add T-SQL to run before and after the load process.
Stage Tables
Stage tables are where all the work actually takes place. This is where you can modify the SQL to change the data from the Load tables into another form, add key’s, reformat fields, and so on. It’s possible to have multiple stage tables daisy-chaining into one another, so your final stage table would be the data as it would be prior to the Dimension or Fact Table.
Dimensions and Fact Tables
Finally, you have the dimension and fact tables, and these are populated by the prior stage tables. By this point, you should have all your data ready to go.
Get to the Point!
 By this point, you’re probably thinking, this has little to do with T-SQL, or Automating it.… Well, I’m coming to that. What RED does is generate T-SQL for you, handle it all using a Source control system, and allow you to automate the processing using a Scheduler.
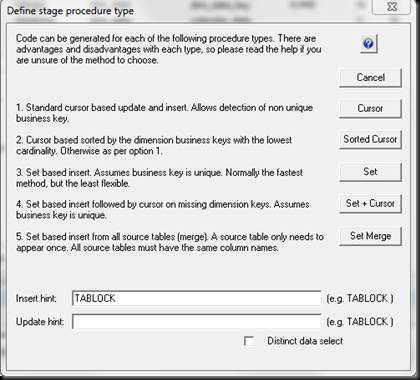
From my experience, the Generated SQL is very performant, and the wizards that are used to get the information required to generate them, give you plenty of rope to hang yourself with.
As you can see from the screen on the left, you can choose how the data would be accessed, and add Hints if need be.
Jobs and Scheduling
One of the really nice things about RED is the scheduling function. Through this, you can setup  multiple tasks (such as Load_customer, load_product, stage_customer_1, stage_customer_2, etc.), define the threads that can be used, and how they interact. Therefore you can load the customer and products tables from the source system simultaneously, and similarly with any other sets of tasks. While RED doesn’t suggest how this would be achieved (it doesn’t know your source systems, or how which jobs are likely to interact), it will allow you to specify the parallelism to a high degree of granularity.
You can also set dependencies (so, don’t run this job until this other one has completed), and you can run commands based on the success or failure of the jobs also. This means you can send custom emails based on the results. All logging of the jobs is also written to a database, so you can query on it to see if tasks are taking longer over time, and if there are any spikes in time taken.
What’s Next ??
Hopefully, you’ve found this interesting. I’d highly recommend trying out RED as it’s a great tool for automating the loading of data. I’d welcome any feedback you have about this article.
Happy T-SQL Tuesday!


