Category: Optimization


Recently, I’ve been learning about the Statistical language R. To allow me to do some testing against it, I wanted to get a decent sized dataset into SQL Server.

Having found a good dataset, the Airlines data from the 2009 Data Expo, I downloaded it, and proceeded to try and load it into SQL Server. I failed almost straightaway since the downloaded files were UTF-8 in format, and SQL Server cannot directly load them in using Bulk Copy or BCP.

So, I looked around for another option. I could have used SSIS, however, there seemed to be an issue with the Data Conversion module, where it wasn’t saving the changes having converted the fields from UTF-8 to ASCII.

My next choice was to have a look to see if C# would help. It did. The code below allowed me to take the source file (specified in _filePath) and load it into a database table (specified in _connString).

The code works by creating a DataTable into which the data from the CSV file is loaded. The data is then fed into SQL Server in batches of 100,0000 (parameterised using _batchSize).

Here is the code, it’s pretty well performing on my machine, running at 20-25k rows a second.

using Microsoft.VisualBasic.FileIO;
using System.Data;
using System.Data.SqlClient;

    public class LoadUTF8CSVIntoSQL
    {
        protected const string _filePath = @"C:\Inbox\DataSets\Flights\extract\1987.csv";
        protected const string _connString = @"Server=localhost;Database=Datasets;Trusted_Connection=True;";
        protected const int _batchSize = 100000;

        protected static void LoadDataTable(SqlBulkCopy sqlBulkCopy, SqlConnection sqlConnection, DataTable dataTable)
        {
            try
            {
                sqlBulkCopy.WriteToServer(dataTable);

                dataTable.Rows.Clear();
                System.Console.WriteLine("{0}\t- Batch Written",System.DateTime.Now.ToString());
            }
            catch (System.Exception ex)
            {
                System.Console.WriteLine("ERROR : "+ex.Message);
            }
        }

        public static void LoadCsvDataIntoSqlServer(string sFilePath)
        {
            try
            {
                // This should be the full path
                var fileName = "";
                if (sFilePath.Length == 0)
                {
                    fileName = _filePath;
                }
                else
                {
                    fileName = sFilePath;
                }

                var createdCount = 0;

                using (var textFieldParser = new TextFieldParser(fileName))
                {
                    textFieldParser.TextFieldType = FieldType.Delimited;
                    textFieldParser.Delimiters = new[] { "," };
                    textFieldParser.HasFieldsEnclosedInQuotes = false;

                    var connectionString = _connString;

                    var dataTable = new DataTable("airlines");

                    // Specify the columns in the Data Table
                    dataTable.Columns.Add("Yr");
                    dataTable.Columns.Add("Mth");
                    dataTable.Columns.Add("DayofMonth");
                    dataTable.Columns.Add("DayOfWeek");
                    dataTable.Columns.Add("DepTime");
                    dataTable.Columns.Add("CRSDepTime");
                    dataTable.Columns.Add("ArrTime");
                    dataTable.Columns.Add("CRSArrTime");
                    dataTable.Columns.Add("UniqueCarrier");
                    dataTable.Columns.Add("FlightNum");
                    dataTable.Columns.Add("TailNum");
                    dataTable.Columns.Add("ActualElapsedTime");
                    dataTable.Columns.Add("CRSElapsedTime");
                    dataTable.Columns.Add("AirTime");
                    dataTable.Columns.Add("ArrDelay");
                    dataTable.Columns.Add("DepDelay");
                    dataTable.Columns.Add("Origin");
                    dataTable.Columns.Add("Dest");
                    dataTable.Columns.Add("Distance");
                    dataTable.Columns.Add("TaxiIn");
                    dataTable.Columns.Add("TaxiOut");
                    dataTable.Columns.Add("Cancelled");
                    dataTable.Columns.Add("CancellationCode");
                    dataTable.Columns.Add("Diverted");
                    dataTable.Columns.Add("CarrierDelay");
                    dataTable.Columns.Add("WeatherDelay");
                    dataTable.Columns.Add("NASDelay");
                    dataTable.Columns.Add("SecurityDelay");
                    dataTable.Columns.Add("LateAircraftDelay");

                    using (var sqlConnection = new SqlConnection(connectionString))
                    {
                        sqlConnection.Open();

                        // Initialise Bulk Copy Object
                        var sqlBulkCopy = new SqlBulkCopy(sqlConnection)
                        {
                            DestinationTableName = "airlines"
                        };

                        // Define column mappings between Data Table and Target Table
                        sqlBulkCopy.ColumnMappings.Add("Yr", "Yr");
                        sqlBulkCopy.ColumnMappings.Add("Mth", "Mth");
                        sqlBulkCopy.ColumnMappings.Add("DayofMonth", "DayofMonth");
                        sqlBulkCopy.ColumnMappings.Add("DayOfWeek", "DayOfWeek");
                        sqlBulkCopy.ColumnMappings.Add("DepTime", "DepTime");
                        sqlBulkCopy.ColumnMappings.Add("CRSDepTime", "CRSDepTime");
                        sqlBulkCopy.ColumnMappings.Add("ArrTime", "ArrTime");
                        sqlBulkCopy.ColumnMappings.Add("CRSArrTime", "CRSArrTime");
                        sqlBulkCopy.ColumnMappings.Add("UniqueCarrier", "UniqueCarrier");
                        sqlBulkCopy.ColumnMappings.Add("FlightNum", "FlightNum");
                        sqlBulkCopy.ColumnMappings.Add("TailNum", "TailNum");
                        sqlBulkCopy.ColumnMappings.Add("ActualElapsedTime", "ActualElapsedTime");
                        sqlBulkCopy.ColumnMappings.Add("CRSElapsedTime", "CRSElapsedTime");
                        sqlBulkCopy.ColumnMappings.Add("AirTime", "AirTime");
                        sqlBulkCopy.ColumnMappings.Add("ArrDelay", "ArrDelay");
                        sqlBulkCopy.ColumnMappings.Add("DepDelay", "DepDelay");
                        sqlBulkCopy.ColumnMappings.Add("Origin", "Origin");
                        sqlBulkCopy.ColumnMappings.Add("Dest", "Dest");
                        sqlBulkCopy.ColumnMappings.Add("Distance", "Distance");
                        sqlBulkCopy.ColumnMappings.Add("TaxiIn", "TaxiIn");
                        sqlBulkCopy.ColumnMappings.Add("TaxiOut", "TaxiOut");
                        sqlBulkCopy.ColumnMappings.Add("Cancelled", "Cancelled");
                        sqlBulkCopy.ColumnMappings.Add("CancellationCode", "CancellationCode");
                        sqlBulkCopy.ColumnMappings.Add("Diverted", "Diverted");
                        sqlBulkCopy.ColumnMappings.Add("CarrierDelay", "CarrierDelay");
                        sqlBulkCopy.ColumnMappings.Add("WeatherDelay", "WeatherDelay");
                        sqlBulkCopy.ColumnMappings.Add("NASDelay", "NASDelay");
                        sqlBulkCopy.ColumnMappings.Add("SecurityDelay", "SecurityDelay");
                        sqlBulkCopy.ColumnMappings.Add("LateAircraftDelay", "LateAircraftDelay");

                        // Loop through the CSV and load each set of 100,000 records into a DataTable
                        while (!textFieldParser.EndOfData)
                        {
                            if (createdCount == 0)
                            {
                                textFieldParser.ReadFields();
                            }
                            dataTable.Rows.Add(textFieldParser.ReadFields());

                            createdCount++;

                            if (createdCount % _batchSize == 0)
                            {
                                LoadDataTable(sqlBulkCopy, sqlConnection, dataTable);
                            }
                        }

                        // Send a final set to SQL Server
                        LoadDataTable(sqlBulkCopy, sqlConnection, dataTable);

                        sqlConnection.Close();
                    }
                }
            }
            catch (System.Exception ex)
            {
                System.Console.WriteLine("ERROR : "+ex.Message);
            }
        }

        static void Main(string[] args)
        {
            try
            {
                var filePath = "";

                try
                {
                    filePath = args[0];
                }
                catch (System.Exception)
                {
                    filePath = "";
                }


                System.Console.WriteLine("{0}\t- Starting load of {1}", System.DateTime.Now.ToString(), filePath);
                LoadUTF8CSVIntoSQL.LoadCsvDataIntoSqlServer(filePath);
                System.Console.WriteLine("{0}\t- Completed load of {1}", System.DateTime.Now.ToString(), filePath);
            }
            catch (System.Exception ex)
            {
                System.Console.WriteLine("ERROR : "+ex.Message);
            }
        }
   
}

Over the past few evenings, I’ve been playing with SQLIO, to get an idea of how SSD compares to a couple of servers (one quite old, one a bit newer) that I have access too.

SQLIO can be used to do performance testing of an IO subsystem, prior to deploying SQL Server onto it. It doesn’t actually do anything specifically with SQL, it’s just IO.

If you haven’t looked at SQLIO, I would highly recommend looking at these websites:

http://www.sqlskills.com/BLOGS/PAUL/post/Cool-free-tool-to-parse-and-analyze-SQLIO-results.aspx

http://tools.davidklee.net/sqlio/sqlio-analyzer.aspx

The SQLIO Analyser, created by David Klee, is amazing. It allows you to run the SQLIO package (a preconfigured one is available on the site) and submit the results. It then generates an Excel file that contains various metrics. It’s nice!

Running on my Laptop…

Having run the pre-built package on my laptop, I got the following metrics out of it. As you can see, it’s an SSD  (Crucial M4 SSD), and pretty nippy.

image

image

Interesting metrics here, and one of the key benefits of an SSD, is that regardless of what you are doing, the average latency is so low. For these tests, I was getting:

Avg. Metrics Sequential Read Random Read Sequential Write Random Write
Latency (ms) 19.28ms 18.38ms 23.21ms 51.51ms
Avg IOPs 3777 3493 2930 1340
MB/s 236.07 218.3 183 83.7

Running on an older server

So, running this on an older server, connected to a much older (6-8+ years old) SAN gave me these results. You can see that the metrics are all much lower, and there is a much wider spread of for all the metrics, and that is down to the spinning disks.

image

image

As you can see from the metrics below, there is a significant drop in the performance of the server, a lot more variance across the load types.

Avg. Metrics Sequential Read Random Read Sequential Write Random Write
Latency (ms) 24.81ms 66.79 373 260
Avg IOPs 1928 710 186 210
MB/s 120 44.3 11.6 13.14

Slightly newer Server

So, next I had the SQLIO package running on a slightly newer server (with a higher spec I/O system, I was told), which gave the following results.

image

image

As expected, this did give generally better results, it is interesting that Sequential read had better throughput on the older server.

Avg. Metrics Sequential Read Random Read Sequential Write Random Write
Latency (ms) 35.13 44.17 41.81 77.44
Avg IOPs 1474 1021 1314 794
MB/s 92.7 63.8 82.8 49.6

Cracking open VMware

Since I use VMware Workstation for compartmentalising projects on my laptop, I thought I’d run this against a VM. The VM was running on the SSD (at the top of the post), so I could see how much of an impact the VMware drivers had on the process. This gave some interesting results, which you can see below. Obviously there is something screwy going on here, it’s not likely that the VM can perform that much faster than the drive it’s sitting on. Would be nice if it could though…

image

image

Avg. Metrics Sequential Read Random Read Sequential Write Random Write
Latency (ms) 7.8 7.5 7.63 7.71
Avg IOPs 12435 13119 15481 14965
MB/s 777 819 967 935

While the whole process was running, Task manager on the host machine was sitting at around 0-2% for disk utilisation, but the CPU was sitting at 50-60%. So, it was hardly touching the disk.

image

Conclusion

Just to summarise this, in case you didn’t already know, SSD’s are really quick. For the testing I was doing, the SSD was giving me approx. double the performance from some pretty expensive hardware (or at least it was 5-10 years ago…)

Also, take your test results with a grain of salt.

I’ve been looking at how it might be possible to bring data from Twitter into SQL Server.

You might ask, Why ????

Well, why not ? It’s more an exercise in how this could be done using tools that are available.

There are several steps that I went through, and I’m pretty sure there may be a better way, and if you can think of any improvements, then feel free to use the comments section below.

Step 1 – Getting the Tweets

First up, we need to get the Twitter data. There are numerous ways to do this, however, the easiest way I’ve found is to use a product called cURL (available here: http://curl.haxx.se/download.html).

I saw this referenced while investigating the Microsoft Hadoop on Azure site (https://www.windowsazure.com/en-us/develop/net/tutorials/hadoop-social-web-data/) which was used to extract data to feed into a Hive database.

There are three parts to obtaining the Twitter data using cURL.

Part 1 – Get cURL, you can download this using the link above. I used the Win64 Binary SSL version.

Part 2 – Create a parameters file. As the MS link above shows, the parameters file acts as a filter to get the data you want from the Twitter feed. While it is possible to filter the data by hashtags, I wanted to get a more generalised set of data. To do this, I put the following filter in the parameters file. This effectively filters the data by any tweets that are geotagged.

locations=-180,-90,180,90

Part 3 – Create a batch file to run the job. The batch file created is effectively the same as the one referenced in the MS link. The file is called GetTwitterStream.cmd, and contains the following text. You need to replace <twitterusername> and <twitterpassword> with your twitter credentials.

curl -d @twitter_params.txt -k https://stream.twitter.com/1/statuses/filter.json –u<twitterusername>:<twitterpassword> >>twitter_stream_seq.txt

When you run the GetTwitterStream.cmd file, it starts cURL and starts getting data from the public Twitter streaming API, as shown below.

image

This gives us a file containing the JSON feed from Twitter.

Step 2 – Load the Twitter JSON Data into SQL

Next we need to get the JSON data from Twitter into SQL. I created a Load table for this, with the following structure:

CREATE TABLE [dbo].[TweetJSON](
[JSONData] [varchar](8000) NULL,
[ID] [int] IDENTITY(1,1) NOT NULL,
[Processed] [char](1) NULL
) ON [PRIMARY]

Then, we can load the JSON file created from cURL in step 1, using BULK INSERT. We need a Format file for this, shown below, and called BIFormatFile.txt

9.0
1
1 SQLCHAR 0 8000 “\r\n” 1 [JSONData] “”

The data can then be loaded using this Bulk Insert task:

BULK INSERT [dbo].[TweetJSON]
from ‘c:\BigData\TwitterData\twitter_stream_seq.txt’
with (CODEPAGE=’RAW’, FORMATFILE=’C:\BigData\twitterdata\BIFormatFile.txt’)

So now, we have a table with the JSON data in, and an Identity column to give us an ID we can reference.

Step 3 – Parse the JSON

Phil Factor has written a great article (here http://www.simple-talk.com/sql/t-sql-programming/consuming-json-strings-in-sql-server/), which covers parsing JSON in T-SQL. I used the parseJSON function from this article, to extract the required fields from the Load table.

I created a staging table:

CREATE TABLE [dbo].[TweetJSONStaging](
[Country] [varchar](200) NULL,
[id_str] [varchar](200) NULL,
[followers_count] [int] NULL,
[profile_image_url] [varchar](200) NULL,
[statuses_count] [int] NULL,
[profile_background_image_url] [varchar](200) NULL,
[created_at] [datetime] NULL,
[friends_count] [int] NULL,
[location] [varchar](200) NULL,
[name] [varchar](200) NULL,
[lang] [varchar](200) NULL,
[screen_name] [varchar](200) NULL,

[varchar](200) NULL,
[geo_lat] [varchar](200) NULL,
[geo_long] [varchar](200) NULL
) ON [Staging]

Then used the following process to iterate through the data and get it into the right format. The process followed here is to create a Cursor (I’ll get to this in a minute) with the records to change, and call the ParseJSON function against it to split the fields out, then to get the fields we want and insert them into a table. Next we set the Processed flag, and repeat the process till there are no more records to process.

declare @JSON NVARCHAR(MAX), @ID int

declare jsCursor CURSOR FOR
select JSONData, ID from tweetJson where Processed is null

open jsCursor

FETCH NEXT from jsCursor into @JSON, @ID
while @@FETCH_STATUS=0
BEGIN
begin try
insert into TweetJSONStaging ( Country, id_str, followers_count,
profile_image_url,statuses_count,profile_background_image_url,created_at,
friends_count,location,name,lang, screen_name, source, geo_lat, geo_long)
select
max(case when NAME=’country’ then StringValue end) as Country,
max(case when NAME=’id_str’ then StringValue end) as id_str,
max(case when NAME=’followers_count’ then convert (int,StringValue) end)
as followers_count,
max(case when NAME=’profile_image_url’ then StringValue end)
as profile_image_url,
max(case when NAME=’statuses_count’ then convert(int,StringValue) end)
as statuses_count,
max(case when NAME=’profile_background_image_url’ then StringValue end)
as profile_background_image_url,
max(case when NAME=’created_at’ then convert(datetime,
(substring (StringValue,9,2)+’ ‘+substring (StringValue,5,3)+’ ‘+
substring (StringValue,27,4) +’ ‘+substring (StringValue,12,2) +’:’+
substring (StringValue,15,2)+’:’+substring (StringValue,18,2) ) ) end)
as created_at,
max(case when NAME=’friends_count’ then convert(int,StringValue) end)
as friends_count,
max(case when NAME=’location’ then StringValue end) as location,
max(case when NAME=’name’ then StringValue end) as name,
max(case when NAME=’lang’ then StringValue end) as lang,
max(case when NAME=’screen_name’ then StringValue end) as screen_name,
max(case when NAME=’source’ then StringValue end) as source,
max(case when element_id=’1′ then StringValue end) as geo_lat,
max(case when element_id=’2′ then StringValue end) as geo_long
from dbo.parseJSON( @JSON)

update tweetJSON
set Processed = ‘Y’
where ID=@ID

end try
begin catch
update tweetJSON
set Processed = ‘X’
where ID=@ID
end catch
FETCH NEXT from jsCursor into @JSON, @ID

end
close jsCursor
deallocate jsCursor

To allow this process to run in a reasonable amount of time, I created a couple of indexes on the load table (tweetJSON). The indexes are on the ID field (Clustered Index) and on the Processed flag.

CREATE UNIQUE CLUSTERED INDEX CI_ID ON [dbo].[TweetJSON]
( [ID] ASC ) ON [PRIMARY]

CREATE NONCLUSTERED INDEX NCI_Processed ON [dbo].[TweetJSON]
( [Processed] ASC ) ON [PRIMARY]

Running this process took approx. 26 seconds to load 1000 records, so approx. 38 records a second.

So, I thought I’d try it with a While clause, rather than a cursor, and interestingly, it took the same amount of time to run, for 1000 records.

Update: As raised by Dave Ballantyne (@davebally), this shows that a While clause is effectively doing the same as the Cursor, since the process is still running over records one by one. (Further information can be found here).

declare @JSON varchar(8000), @ID int, @count int

while 1=1
BEGIN
select top 1 @JSON = JSONData, @ID=ID from tweetJson where Processed =’N’
begin try
insert into TweetJSONStaging ( Country, id_str, followers_count,
profile_image_url,statuses_count,profile_background_image_url,created_at,
friends_count,location,name,lang, screen_name, source, geo_lat, geo_long)
select
max(case when NAME=’country’ then StringValue end) as Country,
max(case when NAME=’id_str’ then StringValue end) as id_str,
max(case when NAME=’followers_count’ then convert (int,StringValue) end)
as followers_count,
max(case when NAME=’profile_image_url’ then StringValue end)
as profile_image_url,
max(case when NAME=’statuses_count’ then convert(int,StringValue) end)
as statuses_count,
max(case when NAME=’profile_background_image_url’ then StringValue end)
as profile_background_image_url,
max(case when NAME=’created_at’ then convert(datetime,
(substring (StringValue,9,2)+’ ‘+substring (StringValue,5,3)+’ ‘+
substring (StringValue,27,4) +’ ‘+substring (StringValue,12,2) +’:’+
substring (StringValue,15,2)+’:’+substring (StringValue,18,2) ) ) end)
as created_at,
max(case when NAME=’friends_count’ then convert(int,StringValue) end)
as friends_count,
max(case when NAME=’location’ then StringValue end) as location,
max(case when NAME=’name’ then StringValue end) as name,
max(case when NAME=’lang’ then StringValue end) as lang,
max(case when NAME=’screen_name’ then StringValue end) as screen_name,
max(case when NAME=’source’ then StringValue end) as source,
max(case when element_id=’1′ then StringValue end) as geo_lat,
max(case when element_id=’2′ then StringValue end) as geo_long
from dbo.parseJSON( @JSON)

update tweetJSON
set Processed = ‘Y’
where ID=@ID

end try
begin catch
update tweetJSON
set Processed = ‘X’
where ID=@ID
end catch

select @count=count(1) from tweetJson where Processed =’N’

if @count=0
break
else
continue
end

Thanks for reading! I’ll add an update when I’ve made changes to make it more performant.

During the my preparation for the 70-451 Certification, I did some work on Partitioning. I found this to be quite an interesting exercise, so wanted to share it.

There are a number of reasons that you could do Partitioning, though primarily they are related to performance, and easier maintenance. However, while you can get an increase in performance, it isn’t the answer to all your problems.

The performance gain is through the ability to have a database table spread over multiple I/O devices (through filegroups), though this also gives you the ability to do partial database restores.

Step 1 – Create a database

The First step, is obviously to create a database to play with.

CREATE DATABASE [sandpit] ON  PRIMARY
( NAME = N'sandpit', FILENAME = N'C:\temp\sandpit.mdf' , SIZE = 200mb ,
   MAXSIZE = UNLIMITED, FILEGROWTH = 256000KB )
 LOG ON
( NAME = N'sandpit_log', FILENAME = N'C:\temp\sandpit_log.ldf' ,
   SIZE = 50Mb , MAXSIZE = 2048GB , FILEGROWTH = 256000KB )
GO
use sandpit;
go

Step 2 – Create a Partition Function

The Partition function is used to determine where data appears in the partitions. You specify it as left or right, so the partition value is either to the Left or to the Right. The sample below is right, so 15/10/1992 (19921015) appears in the second partition.

Partition 1 being infinity to  17530101

Partition 2 being 17510101 to 19990101

Partition 3 being 20000101 to 20101231 etc

create partition function myPF (datetime)
as range right for values
('17530101','20000101','20100101','20110101','20120101','20130101','99990101')

Step 3 – Create a Partition Scheme

The Partition Scheme is used to determine which file group the data goes into. There needs to be as many entries in here, as there are in the Partition Function. You cannot specify less, and if you specify more, they will be used in the next partitions (so if you use the Split function, coming later on!). Also in here, we specify the Partition function that we defined previously, to link the two  together.

CREATE PARTITION SCHEME [myPS] as Partition [myPF]
to ([PRIMARY],[PRIMARY],[PRIMARY],[PRIMARY],[PRIMARY],[PRIMARY],[PRIMARY],[PRIMARY])

Step 4 – Create a table using the Partition Scheme

Next we need to create a table. Rather than specifying ‘on <filegroup>’ as normal, we specify the Partition Scheme, and the field used to partition the data. In this case, I’m using the date field for partitioning.

CREATE TABLE [dbo].[myPTable](
    [pKey] [bigint] IDENTITY(1,1) NOT NULL,
    [pDateTime] [datetime] NOT NULL,
    [uidGuid] [uniqueidentifier] NULL,
    [tDesc] [varchar](100) NULL,
 CONSTRAINT [PK_myPTable] PRIMARY KEY NONCLUSTERED
(
    [pKey] ASC,    [pDateTime] asc
))
on     myPS(pDateTime);

This will create our table, but we need data in it, so if you run this script for a while, it’ll populate the table with some random data.

while 1=1
begin
    insert into myPTable
        (pDateTime, uidGuid,tDesc)
    Values (
        dateadd(day, -1 * abs(convert(varbinary, newid()) % ((200*365))),
        dateadd(year,2,getdate())), NEWID(),GETDATE())
end

This script will continue until you run out of disk space, or until the end of time, so you can stop it. You can check the spread of data by running this script. This queries the location of data, gets the partition number, Row count, Min and Max values for the table.

select $partition.myPF(pDateTime) as PartitionNumber, COUNT(1) as RowsInPartition,
    MIN(pDateTime) as MinDateInPartition,MAX(pDateTime) as MaxDateInPartition from myPTable
group by $partition.myPF(pDateTime)

This gives me:

image

Step 5 – Splitting the Partition

As you should (hopefully) see from the query above, there will be significantly more data in the 2nd Partition, than in the others. To help with this, we can split this partition. This can be achieved in two steps: First add a filegroup to the Partition Scheme, then add a split to the Partition Function.

alter partition scheme myPS next used [Primary]
alter partition function myPF() split range ('19500101')

Running the distribution script above, now gives me:

image

There are still quite alot in the 2nd Partition, so lets Split again:

alter partition scheme myPS next used [Primary]
alter partition function myPF() split range ('19000101')

Now we get:

image

Extra Credit 1 – Data Compression by Partition

Partitioning is an Enterprise (and Developer!) edition feature, and so is Data Compression. Given this, we can use data compression on the Partitions, and also have different compression levels on each Partition. So, by using the script below, we can have Page compression on Partition 2 and Row compression on 3-5. (Creating Compressed Tables and Indexes – MSDN)

USE [sandpit]
ALTER TABLE [myPTable]
REBUILD PARTITION = ALL
WITH
(
DATA_COMPRESSION = PAGE ON PARTITIONS(1 to 2),
DATA_COMPRESSION = ROW ON PARTITIONS(3 TO 6)
) ;
GO

Also note, that if you split a compressed table, the new partition will keep the compression from the partition before it was split.

Extra Credit 2 – Data Compression by Index

Interestingly, you can also change the Partitioning on an index. This can be carried out in the following manner:

create clustered index IX_myPTablePKey
on myPTable(pKey,pDateTime)
with (data_compression = Page on Partitions(1 to 2),
data_compression = row on Partitions(3 to 7))

There is further information around Creating Compressed Tables and Indexes here.

T-SQL Tuesday again, and this month it’s hosted by Amit Banerjee at TroubleshootingSQL.

One of the things that I’ve become more aware of, due to preparation for the MCM certification and working on larger data warehousing projects is that multiple database file can always give you a performance improvement.

From testing that I’ve done, this is even apparent on small local databases.

As part of a series of blog posts that I’m doing, around the TPC-H benchmarks, I’ve been loading and and reloading a dataset of approx. 8.6 million records (in 8 entities). This dataset is an example of the default, 1Gb set from the TPC-H benchmark (downloadable here (approx 276mb), or you can read my previous blog article on creating it yourself)

To get some decent figures to show how how much of an improvement you can get with multiple files, I’ve created a script which does the following steps.

    1. Creates the database (2Gb per database file, and 512mb for the log file)
    2. Creates the tables
    3. Bulk loads data using a set of flat files
    4. Gives a count of each of the tables

A copy of the script is available here.

I carried out a few different tests, based on :

  • Single or Multiple files
  • Different Media
    • Running on the C drive (5400rpm SATA drive)
    • Running on USB Pen Drives
    • Running on an eSATA drive
  • Splitting over multiple media
  • Having the Transaction log stored separately

The results I found are shown below (times are shown in Minutes, Seconds, milliseconds (mm:ss:ms) )

image

The benchmark is the run on a single file, on my internal drive.

DB Build is the time to create the database, note that I’m using Instant File Initialisation, and so should you (unless you have a very good reason not to!)

Data load is the time to build the tables and load them

Conclusions

Effectively, you can see the following:

    1. Regardless of media, Multiple files always give a performance improvement
    2. USB Pen Drives are rubbish. Don’t use them for databases
    3. A fast drive, separate to the O/S, and separate from the System database will give a significant improvement

The best performance I managed to achieve was with the multiple database files, using the eSata drive.

However, given that I work primarily on a laptop, the fact that I can get a huge improvement (over a third!) by using multiple database files on the internal drive is impressive.

I’d be interested to know how much of an improvement you get on this, how much does your mileage vary ?

Thanks for reading, and thanks to Amit for hosting.

This’ll be the first in a series of articles I’m planning on writing about the TPC-H Benchmark, and SQL Server.

Recently I attended an HP/Microsoft event, where they discussed the new offerings from the two companies, around the FastTrack Data Warehouse.

Having spent some time reading this document, and looking at the benchmarks in there (BCR – Benchmark Consumption Rate, MCR – Maximum CPU Core Consumption Rate, UDC – Required User Data Capacity and more importantly the QphH), I thought I’d look into them a little more.

I’m going to cover the experiences I had in getting this up and running, which was interesting since I couldn’t find anywhere where there was a reasonable example that ‘anybody’ could use to build a database using this dataset. Also, I wanted to run the benchmarks and see where my laptop was, compared with some of the meatier servers on the TPC-H Top Tens.

To carry these tests out, I’m running on my laptop (Sony Vaio, with i5-430M (2 cores, 4 threads at 2.27Ghz) and 8Gb RAM). I’m aware that this is significantly different to the specification of some of these servers, however, there is also a significant difference in price, and it’s an interesting (to some) test…

Overview

The benchmarks are based on a standard set of benchmark data, the TPC-H data, which is available to download here.

“The TPC Benchmark™H (TPC-H) is a decision support benchmark. It consists of a suite of business oriented ad-hoc queries and concurrent data modifications. The queries and the data populating the database have been chosen to have broad industry-wide relevance. This benchmark illustrates decision support systems that examine large volumes of data, execute queries with a high degree of complexity, and give answers to critical business questions.” – TPC Website

Getting Started – DBGen

To get the dataset, you first need to download the DBGEN Reference data set, which is available from the link above. The dataset is built using an application, which the download contains, in C++ form. I opened the project files using Visual Studio 2010, built them, and got a resulting dbgen.exe file. This was much more straightforward than I was expecting.

There are a number of parameters for this application, but if you run it with the default settings, you get the 1gb dataset. If you use the –s parameter (so the scale factor) set to 10 (so –s10), you get a 10Gb dataset. From the TPC-H Results list, the results are all from 100 upwards (so –s100, to get a 100gb dataset).

Getting Started – SQL Server

Next up, I need to create a database. For the initial test, I created the database on an external drive (connected through eSATA). I used the following script.

CREATE DATABASE [TPCH] ON  PRIMARY
( NAME = N'tpch', FILENAME = N'X:\TPC-H\tpch1gb.mdf' , SIZE = 1024MB , MAXSIZE = UNLIMITED, FILEGROWTH = 128MB ),
( NAME = N'tpch_2', FILENAME = N'X:\TPC-H\tpch1gb_2.ndf' , SIZE = 1024MB , MAXSIZE = UNLIMITED, FILEGROWTH = 128MB )
LOG ON ( NAME = N'tpch_log', FILENAME = N'X:\TPC-H\tpch1gb_log.ldf' , SIZE = 512MB , MAXSIZE = 2048GB , FILEGROWTH = 100MB )
GO

Database tables were created using the following script, which is all built using the schema available in the TPC-H documentation.

CREATE TABLE [dbo].[customer](
    [C_CustKey] [int] NULL,
    [C_Name] [varchar](64) NULL,
    [C_Address] [varchar](64) NULL,
    [C_NationKey] [int] NULL,
    [C_Phone] [varchar](64) NULL,
    [C_AcctBal] [decimal](13, 2) NULL,
    [C_MktSegment] [varchar](64) NULL,
    [C_Comment] [varchar](120) NULL,
    [skip] [varchar](64) NULL
) ON [PRIMARY]
GO
CREATE TABLE [dbo].[lineitem](
    [L_OrderKey] [int] NULL,
    [L_PartKey] [int] NULL,
    [L_SuppKey] [int] NULL,
    [L_LineNumber] [int] NULL,
    [L_Quantity] [int] NULL,
    [L_ExtendedPrice] [decimal](13, 2) NULL,
    [L_Discount] [decimal](13, 2) NULL,
    [L_Tax] [decimal](13, 2) NULL,
    [L_ReturnFlag] [varchar](64) NULL,
    [L_LineStatus] [varchar](64) NULL,
    [L_ShipDate] [datetime] NULL,
    [L_CommitDate] [datetime] NULL,
    [L_ReceiptDate] [datetime] NULL,
    [L_ShipInstruct] [varchar](64) NULL,
    [L_ShipMode] [varchar](64) NULL,
    [L_Comment] [varchar](64) NULL,
    [skip] [varchar](64) NULL
) ON [PRIMARY]
GO
CREATE TABLE [dbo].[nation](
    [N_NationKey] [int] NULL,
    [N_Name] [varchar](64) NULL,
    [N_RegionKey] [int] NULL,
    [N_Comment] [varchar](160) NULL,
    [skip] [varchar](64) NULL
) ON [PRIMARY]
GO
CREATE TABLE [dbo].[orders](
    [O_OrderKey] [int] NULL,
    [O_CustKey] [int] NULL,
    [O_OrderStatus] [varchar](64) NULL,
    [O_TotalPrice] [decimal](13, 2) NULL,
    [O_OrderDate] [datetime] NULL,
    [O_OrderPriority] [varchar](15) NULL,
    [O_Clerk] [varchar](64) NULL,
    [O_ShipPriority] [int] NULL,
    [O_Comment] [varchar](80) NULL,
    [skip] [varchar](64) NULL
) ON [PRIMARY]
GO
CREATE TABLE [dbo].[part](
    [P_PartKey] [int] NULL,
    [P_Name] [varchar](64) NULL,
    [P_Mfgr] [varchar](64) NULL,
    [P_Brand] [varchar](64) NULL,
    [P_Type] [varchar](64) NULL,
    [P_Size] [int] NULL,
    [P_Container] [varchar](64) NULL,
    [P_RetailPrice] [decimal](13, 2) NULL,
    [P_Comment] [varchar](64) NULL,
    [skip] [varchar](64) NULL
) ON [PRIMARY]
GO
CREATE TABLE [dbo].[partsupp](
    [PS_PartKey] [int] NULL,
    [PS_SuppKey] [int] NULL,
    [PS_AvailQty] [int] NULL,
    [PS_SupplyCost] [decimal](13, 2) NULL,
    [PS_Comment] [varchar](200) NULL,
    [skip] [varchar](64) NULL
) ON [PRIMARY]
GO
CREATE TABLE [dbo].[region](
    [R_RegionKey] [int] NULL,
    [R_Name] [varchar](64) NULL,
    [R_Comment] [varchar](160) NULL,
    [skip] [varchar](64) NULL
) ON [PRIMARY]
GO
CREATE TABLE [dbo].[supplier](
    [S_SuppKey] [int] NULL,
    [S_Name] [varchar](64) NULL,
    [S_Address] [varchar](64) NULL,
    [S_NationKey] [int] NULL,
    [S_Phone] [varchar](18) NULL,
    [S_AcctBal] [decimal](13, 2) NULL,
    [S_Comment] [varchar](105) NULL,
    [skip] [varchar](64) NULL
) ON [PRIMARY]
GO

Finally, we get to load the data. I had the source files in the ‘C:\TPC-H\source\’ directory, loading into the database on the external drive (to reduce I/O contention).

The data was loaded using the following:

BULK INSERT part FROM 'C:\TPC-H\source\part.tbl' WITH (TABLOCK, DATAFILETYPE='char', CODEPAGE='raw', FIELDTERMINATOR = '|')
BULK INSERT customer FROM 'C:\TPC-H\source\customer.tbl' WITH (TABLOCK, DATAFILETYPE='char', CODEPAGE='raw', FIELDTERMINATOR = '|')
BULK INSERT orders FROM 'C:\TPC-H\source\orders.tbl' WITH (TABLOCK, DATAFILETYPE='char', CODEPAGE='raw', FIELDTERMINATOR = '|')
BULK INSERT partsupp FROM 'C:\TPC-H\source\partsupp.tbl' WITH (TABLOCK, DATAFILETYPE='char', CODEPAGE='raw', FIELDTERMINATOR = '|')
BULK INSERT supplier FROM 'c:\TPC-H\source\supplier.tbl' WITH (TABLOCK, DATAFILETYPE='char', CODEPAGE='raw', FIELDTERMINATOR = '|')
BULK INSERT lineitem FROM 'C:\TPC-H\source\lineitem.tbl' WITH (TABLOCK, DATAFILETYPE='char', CODEPAGE='raw', FIELDTERMINATOR = '|')
BULK INSERT nation FROM 'C:\TPC-H\source\nation.tbl' WITH (TABLOCK, DATAFILETYPE='char', CODEPAGE='raw', FIELDTERMINATOR = '|')
BULK INSERT region FROM 'C:\TPC-H\source\region.tbl' WITH (TABLOCK, DATAFILETYPE='char', CODEPAGE='raw', FIELDTERMINATOR = '|')
 This data was loaded in the following times
Table 1Gb Dataset 10Gb Dataset
Customers 150,000 1,500,000
Line Items 6,001,215 59,986,052
Nation 25 25
Orders 1,500,000 15,000,000
Part 200,000 2,000,000
PartSupp (Part Supplier) 800,000 8,000,000
Supplier 10,000 100,000
Region 5 5
Resulting source file size 1.03Gb 10.5Gb
Time to load 50 seconds 9 minutes 56 seconds
Resulting SQL DB Size 1.13Gb 11.38Gb

This gives us a basis from which to run the benchmarks, and do some optimisations.

Next time, I’ll look at running through some of the optimisations, and get some benchmarks out of this system.


You can also read an article, written by Neil Robbins, on this topic also, here: http://blog.semeosis.com/2011/07/03/putting-the-star-schema-benchmark-to-work-with-sql-server-2008r2/

I was working with a file, for a previous post, through which I had a large file to upload. I’ve used 7-Zip for a while, but this is the first time I’ve really noticed differences against a Zip file.

Below is a chart of my findings (each using the highest available compression format):

Format Size Compression ratio of Original
Original file 58,412 KB
.7z 3,173 KB 5.4%
.Zip 25,490 KB 43.6%
.bz2 21,875 KB 37.4%
.gzip 25,459 KB 43.5%
Windows Compressed Folder 27,247 KB 46.6%

As you can see, using the .7z format gives a substantial improvement in compression over any of the other formats.

I hereby highly recommend 7-zip! Winking smile

Disclaimer: Results will vary with different content! !

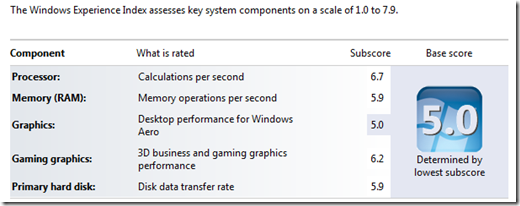
I’ve recently had my work laptop upgraded to a Sony VAIO VBCEB1Z0E, which is pretty nice (nice = lighter, faster, higher res screen, and runs cooler too!).

And the WEI for it it this:

image

However, from running a virtual machine on it, in VMware Workstation (my virtualisation tool of choice), I get a WEI of this:

image

So, the Virtual machine has faster Desktop graphics, and faster primary hard disk. Given that, if VMware can beef up their 3d Graphics and  Memory access drivers, then a VM on this laptop could be faster than the actual laptop. How cool would that be ?

… and it runs ok!!!!

image

image

I got it installed in 30 mins, and its running using less than 1/2 a gig RAM, so plenty of space left for other apps to run on. Sweet! 🙂

Well, just like a lot of other people, I’m now using Windows Server 2008 as a desktop OS. I’ve installed it, and I’ve had absolutely no problems whatsoever.

Windows Vista (32bit) and Server 2008 (64bit) dual booting. I’m really impressed with the performance that Server 2008 is giving me. I was expecting to have some issues as I’m using an Acer Travelmate 2008 and I wasn’t expecting 64bit drivers to be available for the hardware, but most of them are available.

There are a couple of bits of hardware that don’t have drivers : the smartcard feature, which doesn’t get used anyway, and some other thing that doesn’t get detected. Everything else works just fine, and is substantially quicker and smoother than Vista was.

Microsoft Virtual PC warns you about using an unsupported host OS, but still works just fine. Aside from this (and the fact that BlogJet only works if you disable DEP for it) the applications seem to work really well.

Regarding the 64bit applications, I’m surprised that there are so many applications running as 32bit. This includes all the Office applications, Acrobat Reader and a number of other bits.

Here’s a few related links that I found helpful in getting this up and running.

As an idea of the improvement, with nothing running on the OS, and the same services disabled for performance reasons, memory used in Vista is sitting at around 950mb, Server 2008 is sitting around the 800mb mark.

Related Links

http://h0bbel.p0ggel.org/windows-server-2008-as-desktop-laptop-os

http://blogs.zdnet.com/microsoft/?p=1218

http://blogs.msdn.com/vijaysk/archive/2008/02/11/using-windows-server-2008-as-a-super-desktop-os.aspx